By Pierre Ratte
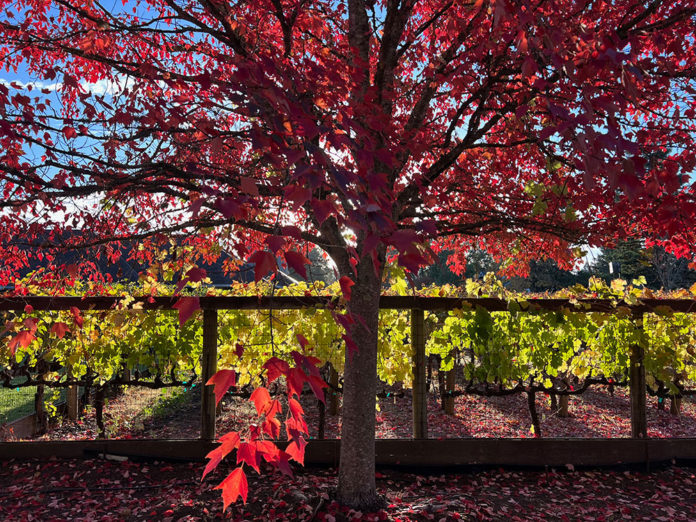
My favorite colors are October and November. Vineyards and deciduous trees put on a show! Rust, red, yellow and green grape leaves compete with maples and walnuts for the brightest, showiest color pop. It’s fun driving around searching for the brightest tree or most colorful vineyard. After a few years, one knows what trees or vines have it goin’ on. And sure enough, year after year, they don’t disappoint. Perhaps you have a favorite place to find fall color? Maybe the trees at BACA?
New England has deciduous woods. Colorado has quaking aspens. And Sonoma County has its straw hills and live oaks framing red, yellow and green vineyards. Mixed together: iconic hills, California’s sun, geothermal white clouds, balmy cloud wisps from the Pacific Ocean setting the stage for vineyards and maples—Sonoma County’s autumnal displays are as spectacular as any.
Fun Facts: Dry conditions, sunny days and cool nights produce the brightest colors. Thank you, Sonoma, for perfect fall weather! Lower temperatures slow chlorophyll’s conversion of CO2 and H2O to sugar and starch. Chlorophyll’s pigment then fades, allowing lighter colors to emerge. Carotenes, the same chemical that makes carrots orange, and xanthophylls, the chemical creating yellows, begin to show. These orange and yellow chemicals are present all summer but obscured by green.
Reds and browns occur from anthocyanins not present in summer. Anthocyanins accumulate when the phloem pathway is blocked and sugars cannot exit the leaf. Different amounts of trapped sugar also vary the color in leaves.
The difference between sugars and starches is essentially semantic. Sugars are mono- or disaccharides; starches are polysaccharides. In other words, more of the same. Similarly, carbohydrates are sugars. The human body breaks down all carbohydrates into glucose, CH2O, a simple sugar, a monosaccharide.
Regulations labeling food for sugars and carbohydrates (as we said, essentially the same) were finalized in 1973 as a result of a 1969 White House Conference on Food, Nutrition and Diet. A standardized intake, the USRDA (U.S. Recommended Daily Allowance) was also developed at that time.
Somehow labeling foods and recommending intake to help dietary outcomes didn’t work. As reported in the Washington Post in 2020, the CDC estimates 74% of adults in the U.S. are overweight, with 43% considered obese.


