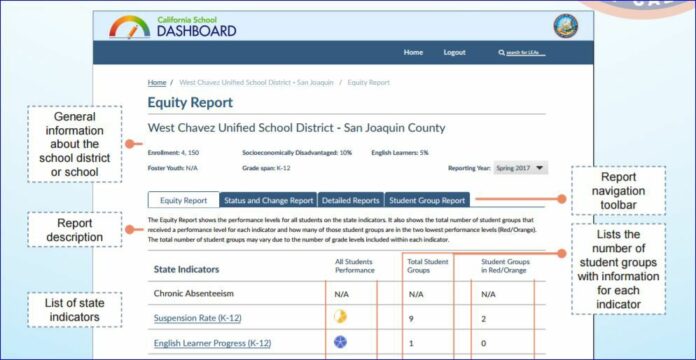
More and more of everyday life is getting pushed onto the internet and “in the cloud.” And now the issue of school accountability, standardized testing and local school performance can be found there too, with a powerful new search tool called the California School Dashboard.
The new internet-based database contains comprehensive results of school and student performance ratings, searchable by individual schools.
Criteria measured includes graduation, absenteeism and suspension rates, academic performance by grade levels, English Learner progress, school climate, parent engagement, basic services and overall trends of improvement or decline.
The new system replaces the Academic Performance Index (API), which California phased out in 2014. The API score was a single number that offered a limited view of school performance.
Sonoma County school superintendent Steve Herrington said the new dashboard tool is a big improvement over the API system.
“A student’s success at school can’t be summed up with just one number,” he said. “Likewise, the California School Dashboard tracks a school or district’s performance across a range of measures so we can know where the school is doing well and where it might need more help.”
The new database and search tool is part of the state’s new accountability system based on the Local Control Funding Formula (LCFF). The dashboard statistics are provided by local school districts and are aimed at analysis and self-reflection within districts, rather than encouraging comparisons between districts, Herrington also said.
“We are moving from an old system that called out ‘good’ and ‘bad’ schools to one that supports all schools in their efforts to continually improve,” Herrington said.
Parents, teachers and the public can view the new school measurements at www.caschooldashboard.org.
A school’s performance in each area is represented by color-coded pie pieces. Blue is the highest level, while red is the lowest. There are also green, orange and yellow pie scales.
The dashboard website launched March 15 is too recent to attract any public comment so far. But state school leaders are lauding the new tool, with former state school superintendent Tom Torlakson calling it a “historic milestone.”
Torlakson likened the new tool to student report cards where students receive multiple grades in multiple subjects.
State Board of Education President Michael W. Krist said, “the Dashboard will help in local decision-making by highlighting both the progress of schools and student groups, shining a light on disparities and helping stakeholders pinpoint where resources should be directed.”
As an example, Analy High School’s graduation rate is scored “blue” (97.7 percent) while El Molino High School’s rate was slightly lower (91.1 percent.) Both schools registered fewer than average suspension rates, except for Hispanics.
At Windsor High School, with a 1,712 enrollment, the graduation rate recorded is 96.9 percent, rated as “very high.” But English Learner progress was rated “very low.”
At Cloverdale High School, with a 389 student enrollment, the graduation rate recorded is 92.1 percent, considered “high” and shown to be “improving.”
At present, all individual school statistics are limited as the new database is still a work in progress.


