Local human rights commissioner sees similar warning signs
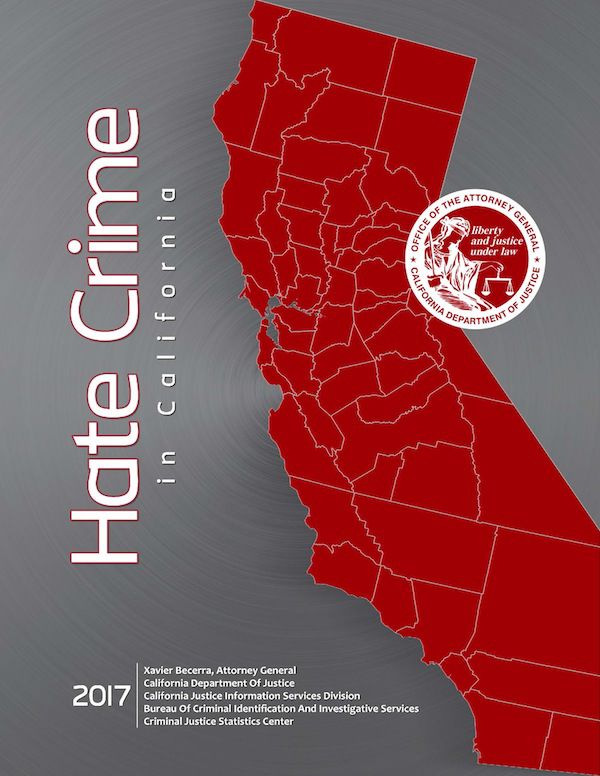
The 2017 Hate Crime in California report is out, and the numbers don’t paint a rosy picture. The annual report collects and organizes data from the entire state for hate crimes within a given year, and then shows any apparent changes or trends. Statewide, and locally, those numbers are on the rise.
The California Penal Code Section 422.55 defines a hate crime as “a criminal act committed, in whole or in part, because of one or more of the following actual or perceived characteristics of the victim: (1) disability, (2) gender, (3) nationality, (4) race or ethnicity, (5) religion, (6) sexual orientation, (7) association with a person or group with one or more of these actual or perceived characteristics.”
With those parameters in mind, according to the report, statewide hate crime events increased 17.4 percent from 931 in 2016 to 1,093 in 2017. The number of victims of reported hate crimes increased 10.9 percent from 1,145 in 2016 to 1,270 in 2017, and the number of suspects of reported hate crimes increased 3.2 percent from 982 in 2016 to 1,013 in 2017.
Locally, Sonoma County experienced 16 events, 19 offenses, 19 victims and 17 suspects of hate crimes in 2017. The sheriff’s department (serving county jurisdiction) had five events, six offenses, six victims and six suspects, Windsor had one event, one offense, one victim and two suspects, Petaluma had eight events, 10 offenses, 10 victims and eight suspects, and Santa Rosa had two events, two offenses, two victims and one suspect.
The total number of hate crimes cases referred for prosecution in the county in 2017 is one, with one case filed as a hate crime. There were no cases filed as non-bias motivated crimes and no dispositions. These numbers can be deceiving however, because cases are frequently not filed or completed in the same calendar year as the offenses so these numbers cannot reflect all the outcomes of these incidents.
D’Mitra Smith, the vice chair of the Sonoma County Commission on Human Rights, though she made clear she was speaking on her own behalf, not the commission’s, says these rising numbers mirror what she has seen in the community, though she cautions that this report may only be the tip of the iceberg.
“If our data on hate crimes is coming solely from law enforcement, it’s not going to be accurate,” she said. “(The numbers) are going to be underreported, because we know there is a huge issue with implicit bias. I think the report is accurate, but there is a lot of anecdotal evidence that might not make it in to evidence.”
“I feel like we need a more public forum of hate crime reporting,” Smith continued. “Some people don’t feel comfortable reporting to law enforcement due to their status, as they are undocumented or not a citizen, and the support and the mechanisms don’t lend themselves to those folks.”
Statewide, hate crimes involving a racial bias increased 16 percent from 519 in 2016 to 602 in 2017. Specifically, anti-black or African American bias events rose from 251 in 2016 to 302 in 2017 (an increase of 20.3 percent) and anti-Hispanic or Latino bias events rose from 83 in 2016 to 126 in 2017 (an increase of 51.8 percent).
Hate crimes involving a religion bias increased 21.1 percent from 171 in 2016 to 207 in 2017. Including anti-Jewish bias events, which rose from 82 in 2016 to 104 in 2017, an increase of 26.8 percent and anti-Islamic (Muslim) bias events, which rose from 37 in 2016 to 46 in 2017.
Hate crimes involving a sexual orientation bias increased 18.8 percent from 207 in 2016 to 246 in 2017. Anti-gay (male) bias events rose from 152 in 2016 to 172 in 2017, an increase of 13.2 percent. Gender crimes make up a relatively small percentage of the overall numbers, but the vast majority of those gender related crimes are against transgender people.
Hate crime offenses increased 10.5 percent from 1,190 in 2016 to 1,315 in 2017, with violent crime increasing 12.1 percent from 767 in 2016 to 860 in 2017 and property crime increasing 8.2 percent from 417 in 2016 to 451 in 2017.
Of the 383 hate crimes that were referred for prosecution, 271 cases were prosecuted, and of those 195 were prosecuted as hate crimes and 76 were prosecuted as non-bias motivated crimes. Of the 124 cases with a disposition available for this report, 52.4 percent (65) were hate crime convictions; 38.7 percent (48) were other convictions; and 8.9 percent (11) were not convicted.
The top three locations for hate crime events are highway/road/alley/street (253), residence/home/driveway (250) and elementary/secondary schools (86). These locations’ ranks are consistent with previous years’ findings. The primary type of crime is assault — both simple and aggravated — with destruction/vandalism taking the top spot in property crimes.
The schools data is of particular concern to Smith, who believes racial incidents in schools are grossly underrepresented. “I hear about a lot of racism in schools,” she said. “And that administrators within the schools, principals or superintendents, are not addressing those problems. We had a civil rights complaint under Title 6 at Analy High and serious violations were found from that, but it was nothing new, they just decided to finally report it.”
She also discussed a phenomenon she says local students call “The Trucks” which consists of what Smith calls “white supremacy masquerading as patriotism” wherein trucks festooned with flags behave aggressively towards people of color, including charging them and trying to run them off the road. Smith said she herself had been run off the road by such a truck.
Of concern is the fact that after seeing hate crime numbers fall from 2011 to 2015, the last two years show a sharp uptick in events. Smith believes there seems to be a clear correlation with the current administration.
“There has been a longstanding culture of hate crimes against low income people and people of color,” Smith said. “They have always been there, but there has been an uptick in that with the recent election cycle. The Southern Poverty Law Center did a study called The Trump Effect, which found an uptick in hate crimes in schools and other places. We have seen an increase with this administration and there is a general sense that human rights are being marginalized, not upheld and really degraded.”
But Smith is hopeful, nonetheless. “At the same time, a lot of people are coming together and it’s all hands on deck and I think that’s happening. There are organizations, grassroots organizations, working on human rights and highlighting violations and bringing accountability to administrators at all levels. A lot goes on under the radar in Sonoma County because there is a sense that there won’t be a consequence.”


