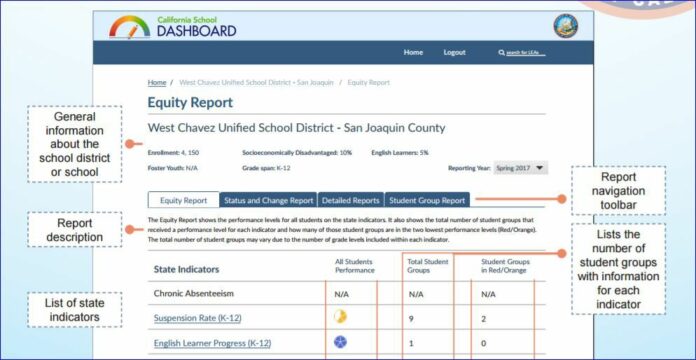
The Healdsburg Unified School District looks strong in English language arts, math and more according to the most recent California Data Dashboard results, which were recently released this spring.
The dashboard — an online tool that shows how local schools are performing in state and local indicators — shows that students in all schools except at the junior high school are showing strong performance in English language arts and in math.
Advanced Placement exam scores have shown a positive increase by 17% and chronic absenteeism has gone down at Healdsburg Elementary School and at Healdsburg Charter School.
Graduation rates have also increased in the district. “Some of the things we are excited about is the graduation rate,” said Erin Fender, the district’s director of curriculum and instruction.
“We saw some nice movement there,” Fender said, adding, “We are seeing some movement in math, particularly at the high school.”
Fender added that English language learner progress has also increased. According to the dashboard report, 41% of the district is well developed in English learner progress, 34% is moderately developed and 17 percent is at somewhat developed.
So just how does this dashboard measure and show progress?
The dashboard, which resembles a speedometer, uses color to indicate the level of progress. For instance positive movement/high increase would relate to the speedometer needle inching to the far right to the green and blue right section.
Fender said she likes to think of it as, “Green is good and blue is excellent.” Negative progress, or a low to significantly low increase, would move the needle to the far left to the red and orange section of the speedometer, while an indicator that has maintained its progress neither increasing or decreasing, would sit in the middle yellow section at the arch of the speedometer.
In this case, local indicators were measured to benchmark the district’s progress. Local indicators include: basic conditions, implementation of academic standards, parent involvement and engagement, school climate surveys and access to a broad curriculum.
State indicators include: Academic indicator, English learner progress, chronic absenteeism, graduation and suspension rate and college and career readiness. And while the 2017-18 dashboard shows positive results among several categories, there are still challenge areas.
While HCS and HES are below the state average suspension rate, English learner, students with disabilities and Hispanic students were at the red level of the dashboard, meaning a majority of those groups increased their suspension rate.
“We are concerned and are working on our suspension rates at our junior high and high school, and the way that manifests is through working more on restorative practices and alternatives to suspension,” she said.
In the “College and Career” indicator, Career Technical Education (CTE) Pathway completion (a sequence of two or more CTE courses within a student’s area of career interest) and the Smarter Balanced Assessment Consortium test results decreased by 12 percent.
There was also a decrease in the percentage of students prepared for college from 2017 to 2018. In the academic performance section English learners and Hispanic students in math had significant decrease in performance and are sitting in the red.
In English and language arts, the junior high saw a slow decline in progress. Data also shows that students with disabilities need extra support in English.
Lastly, chronic absenteeism increased among students with disabilities and Hispanic students at the junior high school.
LCAP
In response to these results the district can use this data to help guide what actions can be identified in the Local Control and Accountability Plan (LCAP), which is a three-year strategic plan for how a district can improve and increase student achievement.
The LCAP is state-mandated and must be updated annually. According to the school board of trustees report, LCAP actions identified in response to the dashboard data include: Implement a new English language arts curriculum, create a blended program, benchmark data, create math support/intervention, implement a math innovation design team, add adaptive software, increase AP scores, create more college tours and improve Spanish Language program and improve communications with families and community.
This is the first collection of data dashboard results, so the district will have to wait to be able to compare and contrast progress from multiple years.
One other thing to consider with the latest data is that schools were closed for 10 days during the wildfires, which decreased the number of school days and had a social/emotional impact.
Fender said of the data, “Last year was the first year it ever came out. It was considered very preliminary data. To be fair I don’t think most people are doing a whole lot of comparison … because it’s just so new.”


